A rare stock market warning signal — one that has preceded major downturns in prior decades — has triggered again in mid-2026, according to an analysis published by Yahoo Finance. The signal has appeared only a handful of times in modern market history, and each prior occurrence was followed by a meaningful drop in equity prices.
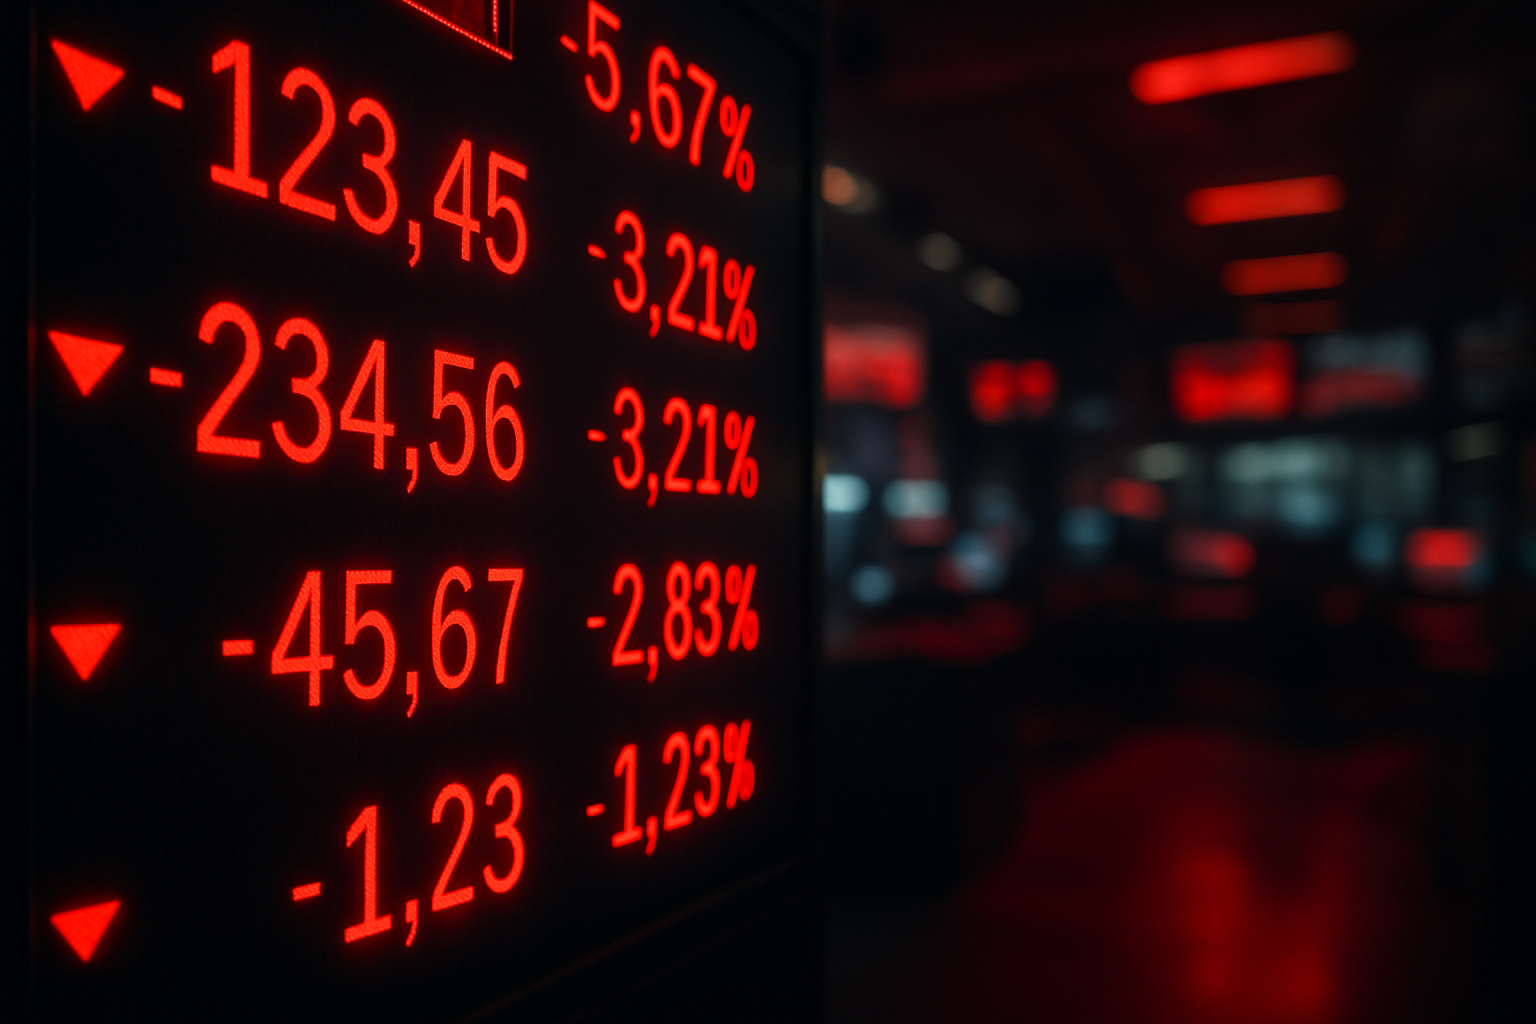
The non-obvious detail buried in the data: the signal does not just predict a short-term pullback. Historically, it has flagged drawdowns averaging well into double-digit percentage territory for the S&P 500, meaning the concern is not a bad week — it’s a bad stretch of months.
What the Stock Market Warning Signal Actually Measures
The indicator in question tracks the relationship between market valuations, breadth, and momentum over rolling multi-month windows. When all three deteriorate simultaneously after a prolonged rally, it produces the kind of divergence that has historically preceded bear market conditions. Analysts note the setup is distinct from routine volatility — it reflects structural pressure building beneath the surface of index-level prices.
The S&P 500 has delivered outsized gains over the past two-plus years, which is precisely what makes the divergence stand out. When an index climbs steeply but the underlying breadth — meaning the share of stocks actually participating in the rally — starts to thin, the advance becomes increasingly fragile. That thinning is a core component of what the current reading reflects.
Momentum, the third leg of the signal, has also softened. Fewer sectors are posting fresh highs, and the indices most sensitive to rate expectations have shown the sharpest deceleration.
How Rare Is This Pattern?
Depending on the specific parameters, this configuration has appeared fewer than ten times since the 1950s. That rarity is part of what makes it worth watching — it filters out the noise of ordinary corrections and flags only the setups where multiple independent stress indicators align at once.
Prior instances coincided with the early stages of some of the most painful market downturns investors can remember. That track record does not guarantee a repeat, and markets can remain elevated for months after a warning surfaces before any decline materializes. Still, the historical win rate of this signal is high enough that institutional strategists treat its appearance as a reason to reassess portfolio risk exposure.
Investor Risk Is Shifting, Not Disappearing
One nuance worth understanding: a warning signal is not a sell-everything alarm. Professional investors who track these patterns typically use them to rebalance — trimming overweight positions in high-valuation growth stocks and rotating toward sectors with lower sensitivity to economic slowdowns, such as consumer staples, utilities, or short-duration fixed income.
The investor risk calculus changes most sharply for people who are close to retirement or who have taken on leverage in their portfolios during the recent rally. For a 35-year-old with decades of runway, a market downturn of 20–30% is painful but recoverable. For someone drawing down savings in the next two to three years, the same drop hits differently.
With extreme summer conditions already straining household budgets across parts of the U.S. in 2026, the timing of any equity softness would compound financial pressure on consumers who have leaned on portfolio gains to offset higher living costs.
What the S&P 500’s Recent Setup Looks Like
The index climbed sharply through late 2025 and into early 2026, driven largely by a concentrated group of large-cap technology names. That concentration is a known vulnerability: when a small number of stocks account for a disproportionate share of index performance, the index can look strong while the median stock in the market is already under pressure.
That divergence between index strength and underlying breadth is precisely the environment where a bear market signal carries the most weight. Breadth measures — like the percentage of NYSE-listed stocks trading above their 200-day moving average — have been trending lower even as headline index numbers held near highs.
What Analysts Are Watching Next
The immediate focus for most analysts is whether breadth can recover over the next four to six weeks. If the participation gap narrows — more stocks joining the rally rather than fewer — the signal could fade without triggering a full bear market. Historically, that kind of breadth recovery has defused similar setups roughly one in four times.
The other variable is the Federal Reserve’s rate path. Any pivot toward easing could inject fresh momentum and widen market participation. Without that catalyst, the structural pressure flagged by the stock market warning signal is likely to persist.
Earnings season, which arrives in mid-July 2026, will provide the next hard data point. If large-cap technology companies report revenue growth that justifies their current valuations, the warning signal’s weight could diminish. If results disappoint — or guidance is cut — the pattern has historically accelerated quickly from warning to realized market downturn.
Investors watching the S&P 500 closely should have an answer by the end of the month.